Fil:Polarisation (Linear).svg
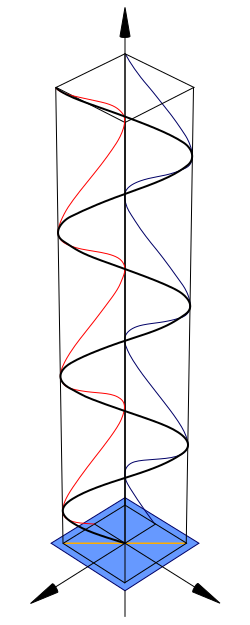
Opprinnelig fil (SVG-fil, standardstørrelse 250 × 625 piksler, filstørrelse: 11 KB)
| Beskrivelse |
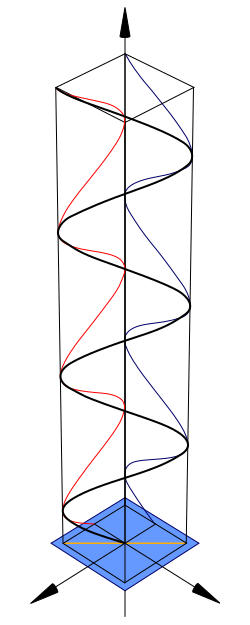
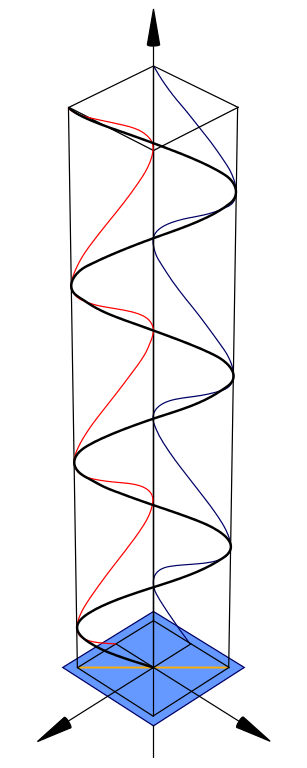
Diagram of linear polarisation. The direction of the black line relative to the central axis represents the direction of the electric field of the linearly polarized light at each point in space. The blue and red lines are projections of the black onto two planes which are at right angles. There is an version which is identical to this original with the exception of phase indictors to make the phase relationship of its components clearer. Refer to Other Versions section below. |
||
| Dato | 12/02/07 | ||
| Kilde |
Own drawing down in Mathematica, edited in the Open Source program Inscape.  Denne vektorgrafikken ble laget med Inkscape . |
||
| Opphavsperson | inductiveload | ||
| Tillatelse (Gjenbruk av denne filen) |
|
||
| Andre versjoner |
Derivative works of this file: Polarisation (Linear) With.Phase.Indicators.svg Circular polarisation Elliptical polarisation |



.svg)
_With.Phase.Indicators.svg)
.svg)
.svg)
Mathematica Code
This figure requires the use of Arrow3D, which is not included in the StandardPackages (as of Feb 2007). This can be obtained from Wolfram Research at this location. The required packages are:
<< Graphics`
<< Arrow3D`Arrow3D`
The code is:
wavefunction=ParametricPlot3D[{Sin[4t],-Sin[4t],t},{t,0,5},
    BoxRatios\[Rule]{1,
      1,4},ImageSize\[Rule]400,Boxed\[Rule]False,Axes\[Rule]False,
      PlotPoints\[Rule]60,ViewPoint->{2,2, 2},PlotRange\[Rule]All]

repsi=ParametricPlot3D[{Sin[4t],-1,t,RGBColor[1,0,0]},{t,0,5},
      BoxRatios\[Rule]{4,1,1},ImageSize\[Rule]500,
      Boxed\[Rule]False,Axes\[Rule]False,
        PlotPoints\[Rule]60,PlotRange\[Rule]All]

impsi=ParametricPlot3D[{-1,-Sin[4t],t,RGBColor[0,0,102/255]},{
    t,0,5},BoxRatios\[Rule]{4,1,1},ImageSize\[Rule]500,Boxed\[Rule]False,
      Axes\[Rule]False,PlotPoints\[Rule]60,PlotRange\[Rule]All]

end=ParametricPlot3D[{Sin[t],-Sin[t],0},{t,0,2π},BoxRatios\[Rule]{4,1,1},
    ImageSize\[Rule]500,Boxed\[Rule]False,Axes\[Rule]False,
      PlotPoints\[Rule]10,PlotRange\[Rule]All]

xaxis=Graphics3D[Arrow3D[{0,0,-1},{
  0,0,6},HeadSize \[Rule] UniformSize[.5],HeadColor\[Rule]Black]]

uaxis=Graphics3D[Arrow3D[{0,-1,0},{0,3,0},HeadSize \[Rule]
    UniformSize[.5],HeadColor\[Rule]Black]]

vaxis=Graphics3D[Arrow3D[{-1,0,0},{3,0,0},HeadSize \[Rule]
      UniformSize[.5],HeadColor\[Rule]Black]]

plane=Graphics3D[Polygon[{{1.2,1.2,0},{1.2,-1.2,0},{-1.2,-1.2,0},{-1.2,1.2,0}}\
]]

crate=WireFrame[Graphics3D[Cuboid[{1,1,0},{-1,-1,5}]]]

Show[wavefunction,xaxis,uaxis,vaxis,plane,repsi,impsi,end,crate]
Filhistorikk
Klikk på et tidspunkt for å vise filen slik den var på det tidspunktet.
| Dato/klokkeslett | Miniatyrbilde | Dimensjoner | Bruker | Kommentar | |
|---|---|---|---|---|---|
| nåværende | 14. feb. 2014 kl. 01:12 | | 250 × 625 (11 KB) | wikimediacommons>老陳 | Refine detail. At the top end, match red blue and black lines |
Filbruk
Den følgende siden bruker denne filen:
.svg)