Fil:Phanerozoic Sea Level.svg

Opprinnelig fil (SVG-fil, standardstørrelse 523 × 360 piksler, filstørrelse: 34 KB)
Beskrivelse
| Beskrivelse |
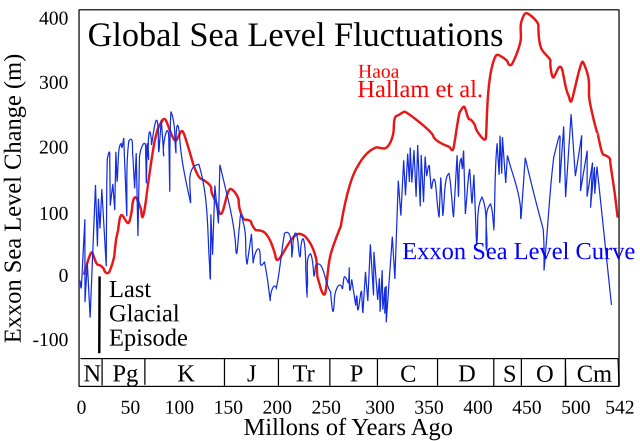
This figure compares the Hallam et al. (1983) and Exxon eustatic (global) sea level reconstructions for the Phanerozoic eon. The Exxon curve [1] is a composite from several reconstructions published by the Exxon corporation (Haq et al. 1987, Ross & Ross 1987, Ross & Ross 1988). Both curves are adjusted to the 2004 ICS geologic timescale. Hallam et al. and Exxon use very different techniques to measuring global sea level changes. Hallam's approach is qualitative and relies on regional scale observations from exposed geologic sections and estimates of the areas of flooded continental interiors. Exxon's approach relies on the interpretation of seismic profiles to determine the extent of coastal onlap in subsequently buried sedimentary basins. Hallam is insensitive to rapid fluctuations in sea level. Exxon is sensitive to rapid fluctuations but tends to overinterpret local geologic changes resulting in bias towards reporting unphysical rapid fluctuations. The depth scale is as reported by Exxon. Because Hallam is reported as qualtitative (i.e. uncalibrated), these sea level changes were scaled to match the Exxon record during the period 0-250 Myr. A black bar is added to indicate the scale of sea level fluctuations during the last glacial/interglacial transition. This change occurred purely within the last 20 kyrs, and note that neither system of measurements is capable of resolving changes on this time scale. It also should be noted that very rapid fluctuations of similar scale are potentially possible during all periods during which large scale ice sheets are present (see: Phanerozoic climate change). On the scale of this figure, the melting of all existing ice sheets would result in a sea level rise of ~80 meters. Changes on larger scales, which evidently occurred many times in the past, are the result of geologic changes in the structure of ocean basins. Essentially, such changes affect the average depth of the oceans relative to the continents. Common symbols for geologic periods appear at the bottom. |
| Dato | (UTC) |
| Kilde |
This file was derived from: Phanerozoic Sea Level.png: |
| Opphavsperson | |
| Andre versjoner | File:Phanerozoic Sea Level es.svg |
| This is a retouched picture, which means that it has been digitally altered from its original version. Modifications: svg. The original can be viewed here: Phanerozoic Sea Level.png:
|
Lisensiering
| Denne filen er lisensiert under lisensen Creative Commons Navngivelse-DelPåSammeVilkår 3.0 Unported | ||
| ||
| Dette lisensmerket ble lagt til filen som del av lisensoppdateringen av GFDL. |

|
Det tillates at dette dokumentet kopieres, distribueres og/eller modifiseres under retningslinjene som beskrevet i GNU fri dokumentasjonslisens, versjon 1.2 eller senere utgave utgitt av Free Software Foundation; med alle seksjoner, uten noen forsidetekster og baksidetekster. En kopi av lisensen er inkludert i avsnittet GNU Free Documentation License. |
Orginal opplastningslogg
This image is a derivative work of the following images:
- File:Phanerozoic_Sea_Level.png licensed with Cc-by-sa-3.0-migrated, GFDL, GWArt
- 2005-12-27T02:24:34Z Angrense 523x360 (23950 Bytes) Variation of the sea level during the Phanerozoic eon. Source:English versin of Wikipedia.
Uploaded with derivativeFX
References
- Hallam, A., Phil. Trans. Royal Soc. B 325, 437-455 (1989).
- Harland, W.B. and many others, A Geologic Time Scale, (1982).
- Haq, B., J. Hardenbol, P. Vail., Science, 235, 156-1167 (1987).
- Ross, C.A. & J.R.P. Ross, Cushman Foundation for Foraminiferal Research Spec. Publ. 24, 137-149 (1987).
- Ross, C.A. & J.R.P. Ross in Sea-level Change: an Integrated Approach (Eds. Wilgus, C.K., Hastings, B.J., Posamentier, H., van Wagoner, J.C., Ross, C.A., and Kendall, C.G. St. C.), SEPM Spec. Pub. 42:71-108 (1988).
Notes
- Because Exxon traditionally used an in-house (i.e. unpublished) system for estimating the geologic age of stratigraphic sections it is not possible to perform an exact recalibration of the time scale. Instead it was adjusted assuming the Harland et al. 1982 time scale was a reasonable approximation.
Filhistorikk
Klikk på et tidspunkt for å vise filen slik den var på det tidspunktet.
| Dato/klokkeslett | Miniatyrbilde | Dimensjoner | Bruker | Kommentar | |
|---|---|---|---|---|---|
| nåværende | 16. aug. 2012 kl. 04:23 | | 523 × 360 (34 KB) | wikimediacommons>AnonMoos | fixing Inkscape flowtext nonsense |
Filbruk
Den følgende siden bruker denne filen: